|
Today my plan was to have a meeting about the database I had been working on, as well as prepare a rough version of my presentation so I could practice presenting it. At the meeting, I was going to explain the changes I made to the database and ask for any additional feedback. I also wanted to keep working on my presentation, so I could present it to someone at Paramount to get comments and make improvements.
When I presented my database changes, I showed the risk adjustment team how the update/append queries work as well as the form for adding rows. After showing that, they mentioned to me that sometimes the fax number changes and they need to update it, but that will cause issues if it isn't updated in the original database and it gets overwritten. So I made a new column for fax numbers specifically for the risk team. The update/append queries fill this value with the normal fax number if it is empty, but leave it untouched if there is a different value in the cell. I also finished a draft of my presentation, which I presented to Jean Harantha. Overall, it went pretty well because she helped me with feedback and writing the proper titles of people's jobs. I explained first the different things I did at Paramount, and then I summarized my individual project. She thought my presentation was pretty good, so I was happy I used an opportunity to get some feedback before I fine tune it and add some other things in. Overall, my last day went really well, but I was sad to be done staying at Paramount. My overall experience was extremely positive and I'm very satisfied I had the opportunity to do this. It was very useful to spend two weeks in a workplace, because I have never really been exposed to that setting for a long period of time. I'm really grateful that Paramount and my sponsor, Kevin Tolles enabled this learning experience and helped shape a great independent study!
0 Comments
Today, I planned on sitting with Kelli, who audits the coding made by providers and Paramount's coders, Joyce, who works in processing claims, and Carrie, who works in risk adjustment as well as doing one-off jobs. I was excited to meet with Kelli because I've heard a lot about the risk adjustment process and why auditing is important but I wanted to see what her job actually looks like. I was also excited to meet with Joyce because claims are the main component of the insurance model and processing them and making the system flow smoothly is very important. Finally, I was looking forward to doing more SQL with Carrie because it's a very useful tool to know.
Auditing is a very crucial part of the risk adjustment process because Paramount needs to be very accurate and uphold strict guidelines when submitting the claims to the government for risk adjustment. Kelli's job mainly consists of looking at insurance claims with diagnosis codes that may be suspect, and looking into the medical records associated with the claim and deciding if there is enough evidence to support the diagnosis. If too many claims pass through that are not supported by the evidence in the medical files, fines and other repercussions will be faced. She explained to me that many times, vendors will add diagnoses that seem completely random or add past diagnoses that aren't accurate anymore, so she has to remove those before they submit the claims. I also met with Joyce, who works in the claims department. She explained to me that most claims pass through the system on their own, but some claims are set to be pending because numbers didn't match up or there is some other issue that causes it to not pay properly. As an adjudicator, she looks through the list of pending claims and fixes the issues so that they can be paid properly. She explained the queueing system which allows easier managing of workflows and assigning tasks to people. She also explained some other parts of her job, such as the Quality Assurance team, which requires them to meet 98% accuracy in all of their claims. Finally, she also told me that they have a trainer hired, so new hires spend 4-6 weeks in training so they are well prepared for working in claims. Finally, I did more work in SQL today. First, I wrote a new query for the database I created earlier. I had to set the RiskComments (the field that I added earlier) to a certain string if the group name of the provider contained a certain word. I did this by writing an UPDATE query and matching against group names that contained that word. I also put additional safeguards in place to preserve comments that were already in place. Later, I did some work with Carrie where I was writing queries to set the status of records as 'Accepted' or 'Rejected' based on whether fields that contained error codes were empty or not. I was glad to do more SQL work because working with databases is a good skill to have developed. Today was good because I got to learn more about risk adjustment and processing of claims, which gave me an even better picture of the whole company. It's really impressive how much work and different departments all contribute to making the company work as a whole. Tomorrow I will be at Paramount again, but I won't be shadowing anybody. I'll just keep working on my presentation before I present it to people at Paramount later in the day tomorrow. I have the part about my independent project done, but I still have quite a bit to do on my part about Paramount. My plans for today included meeting with Nick, who is a developer, meeting with Brad, who is an underwriter, and building more of my presentation which I am presenting on Friday. I was excited to meet with Nick because I have some prior experience with development and it was neat to see it in a health insurance setting. I hoped to see things that I was familiar with already put to use as well as new things I hadn't learned yet. I also was looking forward to learning from Brad because I thought it was interesting how they interact with their clients and set premiums.
When I went to Nick, he explained the different jobs he has as a developer, as well as some general advice. He explained to me that the main claims system, AMISYS, is in many ways outdated, so it has to be treated properly in order to work. For example, he showed me that many dates are stored as actual numbers in the table, not date types, which can be difficult to deal with. He said the system does not have a lot of processing power, especially when several people are trying to use it at once, so it may be more efficient at some times to just pull all the data and process it on a different computer. He also gave me some general advice for a developing career. He said don't expect all your time to be creating things, as most of your time will actually go towards fixing things. He also stressed the importance of knowledge of databases and SQL. Brad works as an underwriter, so he showed me what he does by showing me the spreadsheets he uses as well as the tools he uses to generate reports. He explained that for ACA group plans, he uses the ACA rates given to him by the actuary (David). These values are multiplied by factors associated with location and age, which then determines the final rate. For large non-ACA groups, Paramount assesses how risky a certain group is using surveys and past data, and then determines the total rate for the group. Renewal forms have to be generated at least two months beforehand, so he eventually sends the form to the group's marketer, who then passes it along to the broker. After it gets to the broker, then it goes to the group. The group can accept it immediately, or they will request quotes from other companies and then return the quotes to Paramount. Paramount will either choose to lower their rate to be more competitive or leave it as it is. It was nice to see how a developer works in an insurance company, because I am familiar with coding and computers. It was also interesting to see what an underwriter does, and have it explained to me. Overall, I broadened my view of Paramount because I got to sit with two more people in different departments, and I made more progress on my presentation. I am mostly done with the analytics part of my presentation, and I created the skeleton of the part about my experience at Paramount, which I hope to finish before Friday. My plan for tomorrow is to sit with the people I have scheduled, and work on Paramount part of my presentation. My plan for today was to continue working on my forecast model and also to begin my presentation. I also planned to meet with Devan, who presents data for their client, Promedica, and David, who is an actuary. I wanted to get started on my presentation today because my sponsor set up a time for me to present to people at Paramount on Friday. I want to cover my independent project as well as summarize what I did at Paramount. I also planned to attend a meeting where they discuss conflicting provider information in two databases.
First, I continued working on my forecasting model by creating a set of several different combinations of parameters for the ARIMA model. For each set of parameters, I evaluated the Mean Absolute Percentage Error (MAPE) of the model compared to the actual values. Using this technique, I found that a model with parameters (5, 0, 5) had the least error. However, this model still seemed to have issues because some of the data from decades ago was very turbulent where the recent data was more consistent. This is due to different laws and regulations as I explained in my blog post from yesterday. To make the model fit better, I took the data and used the part from 1996 onwards, which is where the data became consistent. Using this data, I created a model with automatic parameters. The parameters it chose to be most effective were (0, 0, 1). Seeing this model predict values looked much more effective. As always, they tended toward the mean. However, its predictions looked much more accurate. I also worked on my presentation today. So far, I have only begun creating the part where I explain my independent project. I wanted to get a head start on this because I will have to present it on Friday. Hopefully, I can use most of it for my presentation at school on Tuesday. For this part of the presentation, I just explained the steps of my analysis of opioid prescriptions for Medicare beneficiaries. I explained what it implies and how it may be used in a business or healthcare setting. I also generated graphs and charts for each slide to illustrate my point. With Devan, she showed me how she made a dashboard in Tableau for Promedica. When Paramount insures Promedica's employees, they use a self-funded plan, which means Promedica pays all the claims. This also means Promedica has access to all of the health data and dollar amounts sent through Paramount. Her job is to prepare reports and dashboards for Promedica so that they can see which employees are costing the most and how they compare to other hospitals in the state. I also worked with David, who explained to me his job as an actuary. This included the different deadlines he needed to meet, such as setting premiums for the Medicare bid. He showed me the different spreadsheets and data sources he uses to determine these values. After this, he also explained to me the process of him becoming an actuary, which required many difficult exams and tests in college. Today was nice because I continued to work on my independent study and I got a start on my presentation, but I also got to meet more people and go to a meeting. Tomorrow I plan to continue working on my project and presentation. I hope to start the Paramount part of the presentation. I can't finish the project side of it because I am still working on my forecasting model. I am also planning to meet more people tomorrow. Today, my plan was to research the connection between home health and opioid use as much as I could, as well as develop forecasting models for the year-over-year growth of home care spending. I wanted to do research to narrow my focus to how medicare beneficiaries (typically 65 or older) are affected by the opioid epidemic because that's the population my data deals with. A historical context of home health care in the United States was also something I wanted to research because that might help me better understand the trends I saw in funding. Overall, my goal for today was to zoom in on the new trend I discovered in my data and research why that might be happening.
To start off my research, I searched the internet for the history of home health care in the United States. I found this paper, which was very helpful because it detailed the history from the creation of Medicare (1965) up to the present and even predicted future trends. Since my spending data covers 1981 to 2014, this was the time period I would be most interested in learning about. What I found is that home health care was least regulated after 1980 due to the Omnibus Reconciliation Act, which removed regulations on the number of visits, requirements for prior hospitalization, etc. In the graph, this de-regulation is reflected by jagged, sharp spikes. In 1997, with the passage of the Balanced Budget Act, an Interim Payment System was enacted to lower spending. However, this system cut funds much lower than expected, resulting in the only section of the chart where growth is negative. However, in 2000, the Prospective Payment System was put in place to replace the IPS, which led to higher funds but controlled spending, so the graph is smoother over time and does not contain any large spikes like the beginning. I also spent some time developing a forecasting model for the growth rate of home healthcare spending. My sponsor suggested I use a model called ARIMA, which stands for Auto-Regressive Integrated Moving Average. This model is generally good at predicting future values for a stationary time-series, which is what my data appears to be, at least post-2000. The ARIMA model accepts three different parameters: the first parameter p indicates the lag (delay) of the auto-regression, the second parameter d indicates how much to difference (integrate) the model, and q indicates the number of terms used for the moving average. After examining the ACF and PACF charts as well as experimenting, I found that the best model has parameters of (1, 1, 5). The model is not effective for predicting several years in the future. It will always tend towards the average. However, the model is useful for generating predictions for a year or two. You can see my model in the gallery above. Today was a little different because I didn't spend a lot of time looking at new data. Instead, I did research in a more contextual or historical sense, which was a nice break from looking at data all the time. It also helped me gain an understanding of what I was working on and why the trends I'm seeing might be happening. The forecasting model was also interesting because it was something I was completely new to and it was nice to learn about something like that. Tomorrow, I plan to make an objective comparison of the error of each model by testing with several sets of parameters and recording the error that each has. 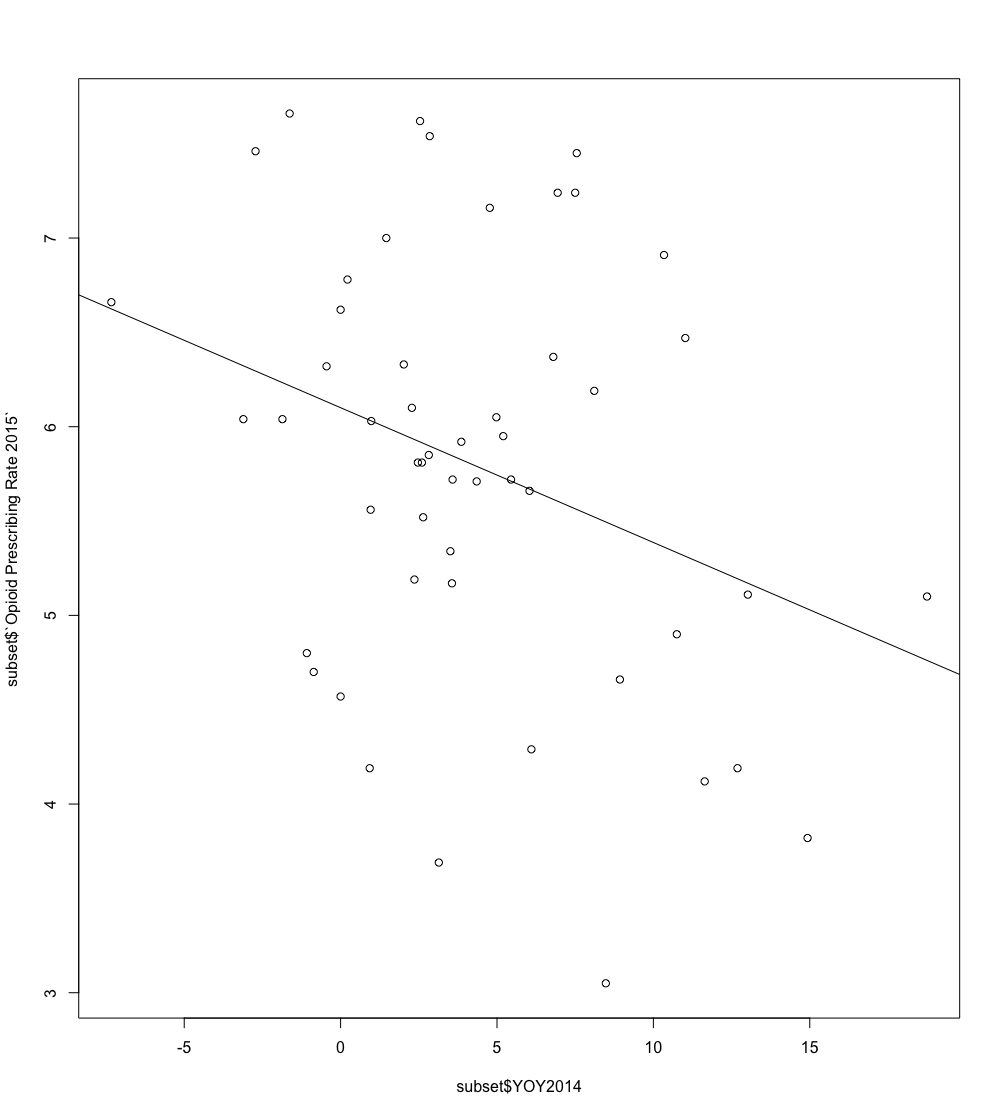 Today, my plan was to finish the work on the database from yesterday and then use the remaining time to continue researching with my independent project. I didn't have any meetings scheduled, so my day was completely open for work. This was helpful because I was able to have long blocks of time that were uninterrupted so I could get working without distractions. I didn't plan to accomplish a lot of different things today, but I hoped to continue making progress.
First, I finished up the database work from yesterday. This included finishing writing the two SQL queries I used to update and insert data from the original database into the new database with the added fields. One important part of testing was making sure that the value in the new field (a comment made by the risk adjustment team) would not be overwritten or deleted in the case of that record's other information changing and requiring updating. Thankfully, it all worked as intended! After completing and testing my queries, I renamed the tables I used to make more sense in the context. I also made aliases in the queries so that the person using them only has to change one name when updating from a table with a different name. After all this, I loaded it on a thumb drive and gave it to my sponsor, who uploaded onto the Paramount system. For the rest of my day, I continued to work on my independent project. First, I researched dummy variable analysis at the recommendation of my sponsor and began to apply it to my project. Dummy variable analysis consists of encoding a categorization with N (such as the region of a state, in my case) as N - 1 variables where each variable is equal to 1 or 0, and the category with no variables being equal to 1 indicating the base case. In Excel, I wrote a simple formula that could be filled across rows and columns that filled out the values of dummy variables. After this, I used R to load the data and perform linear regression analysis. While I was able to do it and build a summary, I haven't yet figured out how to present that data meaningfully. Deciding to switch focus, I added more columns yet again to my spreadsheet indicating the year-over-year growth for each category of healthcare spending in each state. After poking around with this new data, I discovered something interesting: When you compare the year-over-year growth from 2013 to 2014 in home healthcare spending against the opioid prescription rate, it is the only negative trend (see graph above). My theory is that, because the prescription data is for Medicare specifically, so it deals with people 65 and older typically, they are the population segment that would be most likely to have home care, and therefore they are supervised, decreasing the prescriptions of opioids. Having a work day with no other things scheduled was very helpful because it allowed me to make uninterrupted progress on individual projects such as the database queries and my individual project. I'm glad my sponsor gave my the task of setting up that database because it forced me to become at least a little familiar with SQL queries, which is a good tool to know. I'm also happy that I continued to progress with my individual project, which continues to present interesting statistics and relationships. Today is my last day of this week that I plan to be meeting and shadowing with employees. My plans included spending time with Deb Curry, attending more meetings, as well as working on my independent project. Deb Curry manages the coding team at Paramount. I attended a meeting called Rogue, which is a periodic meeting where employees from all different departments meet together to discuss the goings-on at Paramount. Finally, I hoped to continue working on my independent project by importing the data into R and modeling the data separately based on the region of each state.
To start off my day, I sat with Deb Curry, who manages the coding team. First, she showed me the software she uses to manager her employees, which includes the software keeping track of each employee's hours, as well as scheduling meetings and responding to messages. The purpose of the coding team is to ensure that each insurance claim has the proper medical codes based on the medical records. It's crucial for the claims to be coded correctly because it determines the risk score when they submit the claims to the government, which in turn determines how they are reimbursed for the "riskiness" of the population they are insuring. She started off by showing me the book she uses for diagnosis codes that map to the codes the government uses for calculating risk score. Interestingly enough, only about a sixth of the diagnosis codes correspond to a code for risk score, or an HCC. Finally, she made a call to a provider asking about medical records that could help her add more codes that the provider missed before sending the claim to Paramount. Right before lunch, I went to Rogue, which is a meeting that brings together many separate areas of the company. As Jean Harantha explained to me yesterday, when one part of the company changes its process, it can unexpectedly affect a completely different part. At the meeting, they iterated through a list of topics on an email, with each department giving a summary of changes being made, what they need from other departments, and what they plan to do in the future. It was very informative to see how the company functioned on a departmental level and communicated across departments. After this, I was tasked with working on a database that kept track of contact information for providers. My goal was to add a field that could store text for comments made by the time. Although I was not familiar with Microsoft Access, I was able to research my task on the internet and determine how to accomplish it. After I added the field, I also added a corresponding text box on the form that is used to create new records in the database. Finally, I was tasked with writing a query to transfer any data that may have been added to the old copy of the database after the copy was made. Working with SQL queries was not something I was familiar with, but after lots of research and troubleshooting, I was able to write the proper query to update the database. I felt like I learned a lot today because I learned how to use tools like Microsoft Access and SQL queries as well as learning about managing from Deb and attending the meeting. Learning the tools was useful because those can be applied to many settings and are very useful skills to have. Learning about managerial tasks and attending Rogue were good learning experiences as well because they gave me more experiential knowledge of the workplace and communicating through it. Although I didn't get to work on my individual project for more than a few minutes, I plan to keep working on it tomorrow because I don't have anything scheduled, just work time. 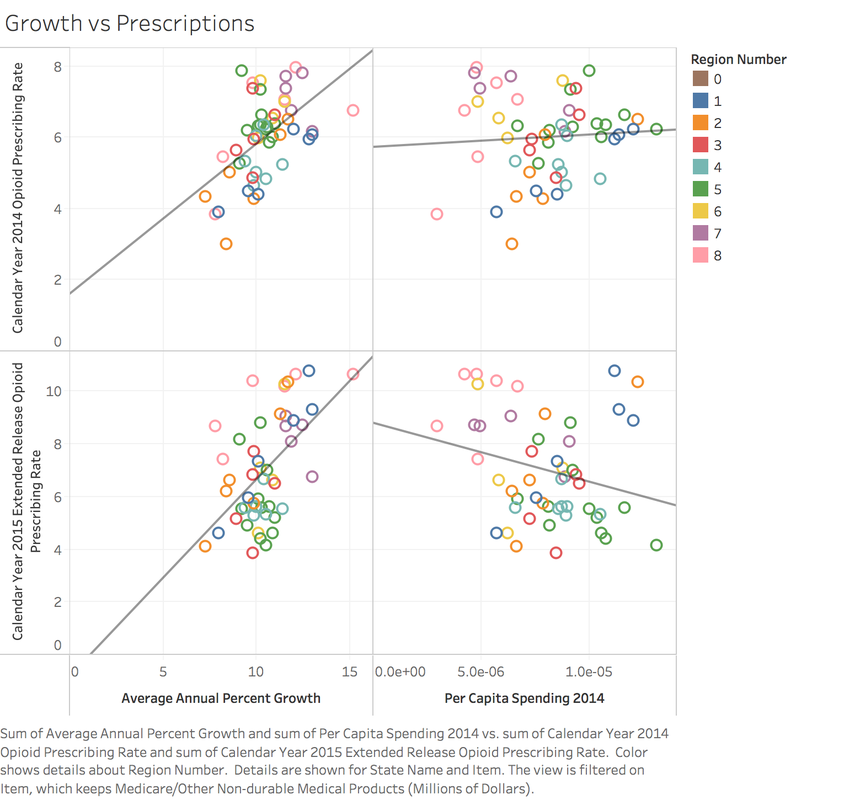 For my second day at Paramount, I was scheduled to meet with David, who works in IT, sit in on an executive meeting, and have some free time to devote to my independent project. With David, my goal was to learn how the computer system at Paramount is structured and how it is fault-tolerant, etc. I hoped to gain an appreciation of the high-level decisions the company is making for its future at the meeting. Finally, I wanted to use my spare time throughout the day to continue my individual project using public data.
To begin my day, I shadowed David, who works for IT. He showed me the different systems they use for automating tasks. They use a database table to automate simple tasks such as sending or retrieving data to another site through FTP, as well as the Sterling Integrator and Tidal to do more complex tasks. After showing me the ticketing system and an example of fixing a problem that popped up, he took me to a meeting with other employees in IT where they discussed how to schedule a new job as well as addressing larger problems. After spending time with David, I sat in on an executive meeting where they discussed plans for their medicare products in 2019. I learned that they expected the initial "risk score" of counties that they are expanding into to be lower. The risk score is the number expressing how "risky" insuring their members is, which determines how much the government reimburses them. It was very interesting to see how ideas were formed and refined at such a high level, where they were discussing their plans for expansion as well as changing their pricing model to offer benefits that better suit the needs of their beneficiaries. Finally, I spent some time working on my independent project. Trying to confirm the trend that greater population density leads to less prescriptions of opioids, I imported data at the county level instead of the state level, which showed no correlation. I saw that the variance was greater at lower populations, which is to be expected because the sample size is smaller, making the deviation greater. This disproved my earlier conclusion. After this, I compared the prescription rate to the prevalence of chronic diseases, such as depression, which still showed no relationship. However, I made a discovery after this. I compared the average annual rate of change of spending on certain areas of healthcare by state. This presented a relatively strong correlation (see the diagram). I even set the color of each dot (representing a state) to represent the region the state belongs to. I noticed that some regions, such as the Southeast and the Rocky Mountains, are closer together, while others are more spread apart. I hope to research this more by creating individual graphs per region. Today was very productive because I got a high level overview of the operations and goings-on of the company as well as making progress on my independent project. The meeting was very informative because it showed me what it looks like for officials at a company to come together and create new ideas and decide the future of the company. I'm really grateful I had an opportunity to observe it. I also feel relieved that I made some new insights on my project. It was frustrating that the population density data turned out to be insignificant, but I was very happy to discover the relationship with growth rate. I plan to continue this research tomorrow as well as continue shadowing and meeting employees at Paramount. Today was my first day at Paramount! My goal was to meet people that I will be working with for the next two weeks, as well as become familiar with the working space. My schedule for the day included spending my first two hours with Jaimie Foster, who works for Paramount Advantage, the Medicaid plan. I also spent my last four hours with Brandon Bock, who has a doctorate in mathematics.
In my time with Jaimie, I was tasked with filling out a spreadsheet that compared the benefits and incentives offered to members of the Paramount Advantage planned with the competing Medicaid providers in Ohio. At first, this task was a little intimidating because I struggled to track down the information required. However, after spending a little bit of time on it I realized all the information I needed could be found in the member handbook of each plan. The information I was searching for included incentives for pregnant woman, incentives for general health, and dental and vision benefits. By the time I finished, I felt more comfortable and knowledgeable about the insurance and Medicaid system. After lunch, I spent my time with Brandon Bock, who has a PhD in mathematics. He showed me a spreadsheet he used as a dashboard for disease management. Disease management concerns aggregating data collected by the insurer that concerns one disease in particular. This data includes how much the insurer spends on treatment, how much the company spends on medication, how many ER visits were made for the disease, etc. For the project I was working on, I made a spreadsheet that breaks this data down for patients with COPD by plan (medicare, medicaid, commercial, etc.) and computes the Z-score for the average of the current year-long period and the past period. The Z-score is used to determine the significance of this change. This task seemed daunting, but I was able to pick up on what I needed to make the Excel sheet work. I also learned the formulas necessary for computing the standard error, Z-score, etc. Overall, today went very well for my first day. It very well meeting new people and getting used to the workspace. At first, some of the work I was given seemed daunting because I was unfamiliar with the task, but I adapted and was able to complete them. I really enjoyed meeting Brandon because he was very knowledgable and he was also helpful. Tomorrow, I hope to continue my work and also continue to meet and work with new people, as well as learn more about my topic. Today I planned to explore the data sets that are publicly available on cms.gov. I know that the amount of data available is almost overwhelming, so I planned to pick one data set and focus on that for the day so I didn't distract myself with all the other data. I wanted to do some brief analysis with it so I could begin to grasp some possible connections, but I also knew I had a limited amount of time today because we had a 2-hour delay before school.
To begin, I began browsing the publicly available data on cms.gov. I had some difficulty narrowing it down to one dataset that interested me, but ultimately I chose to download a table that dealt with the prescription of opiates on a state/county basis. This intrigued me because opiates are an issue that many Americans are affected by, and it would be interesting to gain some insight into that statistics of it. To begin, I plotted the data using Tableau on a map of the United States. You can view the plot in the slideshow at the top of this post. One thing that jumped out to me was that less-densely populated states such as Utah, Idaho, and Nevada had a higher rate of prescriptions that densely populated states such as Texas, California, and New York. To put this idea into statistical terms, I downloaded data from the 2010 US Census, and plotted the population density of each state against its prescription rate of opioids. This graph is in the slideshow as well. In the graph, you can see a trend that, generally speaking, as a state has a greater population density, it has less prescriptions of opiates. To confirm this trend, I added a trend line to the plot. The p-value of this trend is less than 0.0001, which indicates that this is most likely a statistically significant finding. However, the R-squared value is around 30%, which indicates that there is a lot of variation in the data. However, opiate prescriptions are a complex quantity to measure; population density is only one factor. Overall, I was pleased with the results I had come up with already. Overall, I felt as though I were productive today because I picked an issue that was interesting to me and presented some interesting statistics. I am looking forward to digging deeper into this issue. I think my next step is to confirm this relationship between population density and prescriptions on a county basis, which should yield more accurate results do to the increased sample size as well as population density at the county level being a better representation of an area, due to their smaller size. Tomorrow is going to be my first day at Paramount, so I'm looking forward to spending time with the people who do this kind of analysis for a living! |
ArchivesCategories |
 RSS Feed
